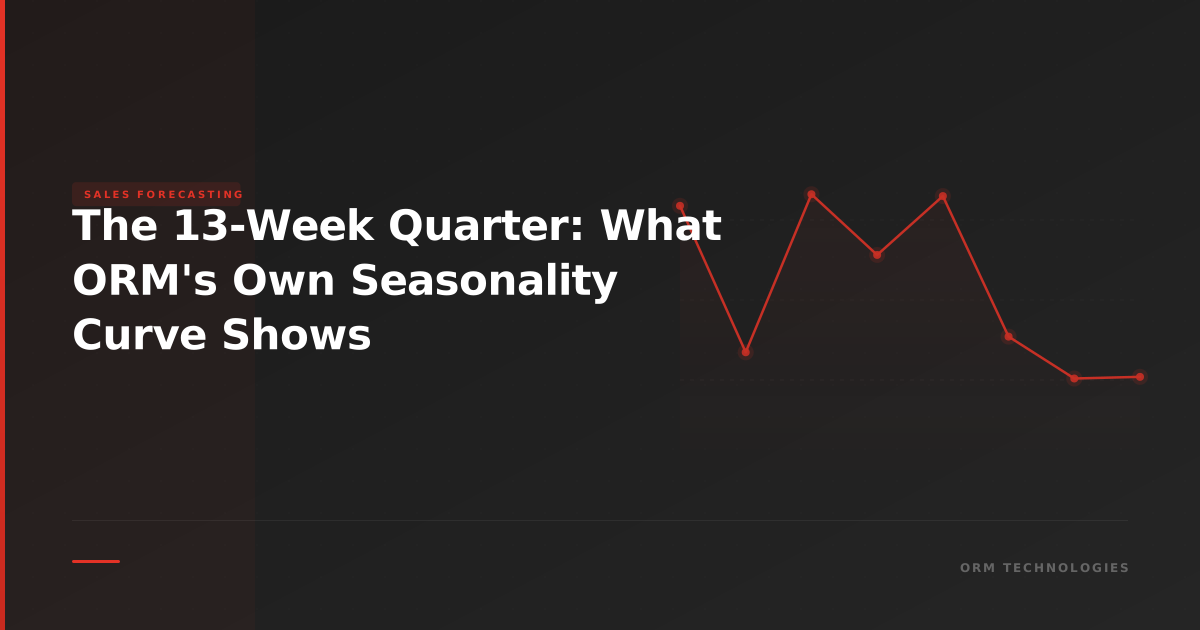
A 13-week seasonality index assigns each week of a quarter a multiplier for how much revenue typically closes then. One example runs 0.70 to 2.27. At the end of week six it shows 34% of the quarter closed, against the 46% a flat model expects.
Most forecast models treat a quarter as thirteen interchangeable weeks. Divide the target by thirteen, track against the line, and raise an alarm when the line is missed. That model is wrong in a specific and predictable way, and the cost of being wrong is that leadership panics in week six and relaxes in week nine, when both reactions should be reversed.
Seasonality is crucial to understand when building forecasts. The impact is not only quarterly. It shows up monthly and weekly inside the quarter too. At ORM we break down each quarter for every customer into a 13-week seasonality and adjust their sales forecast against it.
Here is an actual example of those thirteen weeks.
The curve
| Week | Index | Share of quarter | Cumulative | Flat model says |
|---|---|---|---|---|
| 1 | 0.70 | 5.4% | 5.4% | 7.7% |
| 2 | 0.59 | 4.5% | 9.9% | 15.4% |
| 3 | 0.63 | 4.9% | 14.8% | 23.1% |
| 4 | 0.81 | 6.2% | 21.0% | 30.8% |
| 5 | 0.96 | 7.4% | 28.4% | 38.5% |
| 6 | 0.73 | 5.6% | 34.0% | 46.2% |
| 7 | 0.60 | 4.6% | 38.7% | 53.8% |
| 8 | 1.44 | 11.1% | 49.7% | 61.5% |
| 9 | 0.84 | 6.5% | 56.2% | 69.2% |
| 10 | 0.68 | 5.2% | 61.4% | 76.9% |
| 11 | 1.27 | 9.8% | 71.2% | 84.6% |
| 12 | 1.47 | 11.3% | 82.5% | 92.3% |
| 13 | 2.27 | 17.5% | 100% | 100% |
What the shape actually tells you
Half the quarter has not closed by week eight. Cumulatively the curve reaches 49.7 percent at the end of week eight. A flat model expects 61.5 percent by then. If you are running a business against the flat number you will spend the back half of every quarter believing you are behind. The last three weeks carry 38.6 percent of the quarter. Weeks eleven through thirteen do more than a third of the number between them. Every operational decision that depends on knowing the quarter's outcome, hiring, spend, board messaging, is being made before the majority of the evidence exists. The final week alone is 17.5 percent. Against a flat week of 7.7 percent, the last week does more than triple duty. This is the number that surprises people most, and it is why forecasts that look accurate on the last day of the quarter were often not accurate at all. They were rescued. Week six is the trap. At the end of week six the curve says 34.0 percent of the quarter is closed. The flat line says 46.2 percent. That is a 12.1 point gap created entirely by the model, not by the business. A team that walks into a week six review looking twelve points behind plan is, on this curve, pacing exactly as expected. The escalation that follows costs discounting, pulled-forward deals and credibility, and none of it was necessary.That is the practical argument for building seasonality into the model. Without this type of seasonality in the model you will not be able to tell if you are ahead or behind, or build an accurate forecast by week.
Where the quarterly pattern sits on top
The intra-quarter shape is not the only seasonal effect. Across our customers the typical order of quarters is Q4 largest, followed by Q2, then Q3, then Q1. This is not true for every business, but it has been fairly consistent.
Inside a quarter the monthly pattern is more reliable still. The third month is always the largest and the first month is always the smallest. The weekly curve above is the finer-grained version of that same statement.
The two effects compound. A first month of Q1 is the smallest month of the smallest quarter, which is why January forecasts built on a flat annual model are so consistently overstated.
How to build your own
The curve above is ORM's. Yours will differ, and using someone else's index is only marginally better than using a flat line. The method matters more than the numbers.
1. Pull at least eight quarters of closed-won data, by close date, and normalize each quarter to its own total. You are looking for shape, not volume, so a growing business does not distort the result. 2. Bucket by week of quarter, one through thirteen. Fiscal calendars with a 4-4-5 structure need the weeks aligned to the fiscal definition, not the calendar. 3. Average each week's share across quarters, then divide by the average weekly share to express it as a multiplier. The thirteen values should sum to roughly thirteen, which is the check that the index is built correctly. 4. Split by motion before you trust it. New business, expansion and renewal do not share a shape. Neither do enterprise and commercial segments. A blended curve hides the differences that make the adjustment useful. 5. Re-fit it annually, and check whether a pattern has stopped being real. Seasonality driven by a customer's budget cycle persists. Seasonality driven by one large account's renewal timing does not.
Once you have the index, the application is straightforward. Multiply your weekly expectation by that week's multiplier, and measure quarter-to-date attainment against the cumulative column rather than against a straight line.
What should a CRO do when week six is behind the curve?
Check attainment against the cumulative column first. If week six still trails it, the gap is real. ORM's advice to customers in that spot is three moves, in this order.
1. Find the gap. Deal size, win rate, pipeline and time to close each produce a different gap, and some quarters have more than one. A general push to sell harder at the halfway point spreads effort across every lever, including the healthy ones. Aim at the part that is broken. 2. Find what can still close this quarter. Work the open deals with a credible path to close. Drop the ones that lack a clear path, and put that time into deals the team can win. Deals you can pull forward at close to full price are fair game too. 3. Put executive support where it has the biggest impact. On the deals that matter most, an executive can remove a blocker or open a door to the right decision-maker. The same executive can reinforce value and create urgency.
At week six, better focus beats more activity. The full diagnostic sits in how to diagnose a mid-quarter revenue shortfall.
What this does not fix
A seasonality index tells you whether your pace is normal. It does not tell you whether your pipeline is sufficient, and it will happily report that a doomed quarter is pacing beautifully right up until week thirteen fails to deliver.
It also cannot separate real concentration from manufactured concentration. Some of the back-loading in any curve comes from close dates that were set to the end of the quarter and never validated. Building the index on that data encodes the bad habit into the model. The honest version is to measure the split first, then decide how much of the shape you want to plan around and how much you want to fix. That distinction is covered in why is my quarter always back-loaded.
For the mechanics of applying an index without double-counting it against an existing forecast, see how to add seasonality to a sales forecast. For the underlying definitions, see sales seasonality, revenue linearity, and intra-quarter pipeline pacing.
Frequently Asked Questions
What is a 13-week seasonality curve?
It is an index that assigns each week of a quarter a multiplier describing how much revenue that week typically closes relative to an average week. A value of 1.00 means the week performs like a normal week. ORM builds one of these for each customer and adjusts their sales forecast against it, because a quarter does not close evenly and a model that assumes it does will misread the business every week.
Why does the last week of the quarter close so much business?
Partly real buying behavior, since procurement and budget cycles concentrate around period ends, and partly manufactured, because close dates get set to the end of the quarter without validation. In the example curve on this page the final week carries a 2.27 multiplier, which is more than triple a flat week. The concentration is real enough that any forecast ignoring it will be wrong for twelve weeks and then right on the last day.
How do I know if I am ahead or behind mid-quarter?
Compare quarter-to-date bookings against the cumulative share the curve predicts for that week, not against a straight line. At the end of week six the example curve on this page has only 34 percent of the quarter closed, while a flat model expects 46 percent. A team measured against the flat line looks twelve points behind while actually pacing normally.
Which quarter is usually largest in B2B SaaS?
Across ORM's customers the typical order is Q4 largest, then Q2, then Q3, then Q1. This is not true for every business, but it has been fairly consistent. Within a quarter the third month is always the largest and the first month is always the smallest.

See how ORM turns these insights into action
ORM builds custom revenue forecast models for B2B SaaS companies. Not dashboards. Prescriptive analytics that tell you what to do next.
Schedule a Demo